Log ecology
Vector
Vector is a high-performance observability data pipeline that enables organizations to control their observability data.Collect, convert, and route all logs and metrics to any supplier currently in use, or any other supplier that may be desired in the future.Vector can significantly reduce costs where you need it most (rather than where the supplier finds it most convenient), make data more novel and rich, and provide data security.Vector is open source, and is almost 10 times faster than any alternative solution.
Topological model
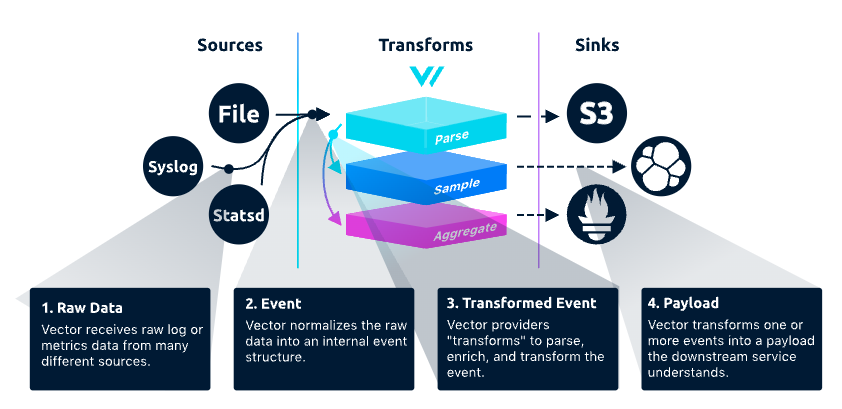
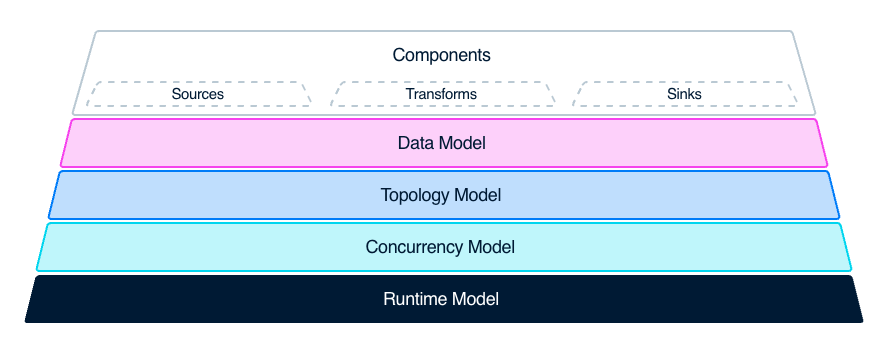
Vector has three main functional modules: Sources, Transforms, Sinks
Data enters Vector from Source, undergoes some Transforms logic for data processing, and finally goes to Sink.A complete data pipeline is composed of three different types of components: Source, Transform, and Sink, in Vector.
Source is a data source that can be collected, such as files, Kafka, Syslog, etc.A Sink is a terminal that receives and consumes data, such as databases like Clickhouse, Splunk, Datadog Logs, or log analysis platforms.
Transform is used to transform, modify, and filter data streams to meet specific needs.It can perform various transformations and processing on input data, such as renaming fields, filtering data rows, adding new fields, deleting fields, etc.By using the transform component, data can be converted to the desired format and routed to the correct destination.Supports multiple conversion methods, including grok, JSON, CSV, regex, lua, etc.It also supports multiple data formats and protocols, such as JSON, YAML, CSV, Syslog, HTTP, TCP, etc.
Sink is the target storage or analysis system where the processed and transformed data stream needs to be sent.Vector supports multiple types of sinks, including file, standard output, TCP/UDP, HTTP, Kafka, S3, Elasticsearch, Datadog, InfluxDB, etc.
Simply summarize the two main types of functions that Vector possesses.
● Data collection and transmission
It can obtain data from the source of data collection and ultimately transmit it to the data consumption end Sink.
● Ability of data processing
You can use the internal Transform function module to parse, sample, aggregate, and process collected data in different ways.
Introduction to the use of Vector
As a tool, the usability of vector is very high.
It supports installation in many different ways, such as downloading installation packages, package managers, etc. After installation, you get a binary Binary, with its only dependency being a configuration file.
Edit configuration file vector.toml
# Change this to use a non-default directory for Vector data storage:
data_dir = "/tmp/cnosdb/lib/vector"

# Random Syslog-formatted logs
[sources.logs]
type = "file"
include = [ "/tmp/cnosdb/1001/log/tsdb.log.*" ]

# Parse Syslog logs
# See the Vector Remap Language reference for more info: https://vrl.dev
[transforms.parse_logs]
type = "remap"
inputs = ["logs"]
source = '''
.message, err = parse_regex(.message, r'(?P<timestamp>\d{4}-\d{2}-\d{2}T\d{2}:\d{2}:\d{2}\.\d+[\+\-]\d{2}:\d{2})\s+(?P<log_level>[A-Z]+)\s+(?P<module>[\w:]+):\s+(?P<message>.+)')
    if err != null {
      log("Error parsing log: " + err)
    }

'''
[sinks.cnosdb]
type = "elasticsearch"
inputs = ["parse_logs"]
endpoints = [ "http://127.0.0.1:8902/api/v1/es/_bulk?table=t1&time_column=date&tag_columns=node_id,operator_system" ]
auth = {strategy = 'basic', user = "root", password = ""}
healthcheck = {enabled = false}
The configuration in the configuration file is roughly divided into three types: sources, transforms, sinks, the concept is the same as mentioned earlier.
Each component has a unique id, prefixed with the component's type.
The first component is sources, with id generate_syslog, type is demo_logs, with syslog as the template, 100 pieces of data.
The second component is transforms, with the id of remap_syslog, inputs tell us it receives data from generate_syslog, the transform type is remap, remap is a powerful transform in handling data in Vector, providing a simple language called Vector Remap language, which allows you to parse, manipulate, and decorate event data passing through Vector.By using remap, static events can be converted into information data to assist in asking and answering questions about the environmental status.Here a parser_syslog function is executed, with the message as the parameter, parsing this syslog into a structured event.
The third component is 'sinks', with the ID 'emit_syslog', which receives data from 'remap_syslog', with the type being terminal, and outputs the data in json format.
Run this command
vector --config vector.toml
You will see some events in json format on the terminal, similar to these:
{"appname":"benefritz","facility":"authpriv","hostname":"some.de","message":"We're gonna need a bigger boat","msgid":"ID191","procid":9473,"severity":"crit","timestamp":"2021-01-20T19:38:55.329Z"}
{"appname":"meln1ks","facility":"local1","hostname":"for.com","message":"Take a breath, let it go, walk away","msgid":"ID451","procid":484,"severity":"debug","timestamp":"2021-01-20T19:38:55.329Z"}
{"appname":"shaneIxD","facility":"uucp","hostname":"random.com","message":"A bug was encountered but not in Vector, which doesn't have bugs","msgid":"ID428","procid":3093,"severity":"alert","timestamp":"2021-01-20T19:38:55.329Z"}
Integration of Vector and CnosDB
Although Vector currently does not support Sink for CnosDB, due to the native support of data import from CnosDB for Vector, users can directly import data into CnosDB through a Sink type of vector.
Write to Vector Log
The vector configuration file is as follows
data_dir = "/tmp/vector"

[sources.in]
type = "file"
include = ["/tmp/MOCK_DATA.json"]

[transforms.json_transform]
type = "remap"
inputs = ["in"]
source = '''
    . = parse_json!(.message)
    # 写入的租户名
    ._tenant = "cnosdb"
    # 写入的数据库名
    ._database = "public"
    # 写入的表名
    ._table = "vector_log_test"
    # 用户及密码
    ._user = "root"
    ._password = ""
'''

[sinks.cnosdb]
type = "vector"
inputs = ["json_transform"]
address = "127.0.0.1:8906"
It is important to note that the parameters such as tenant, database, etc. need to be configured in the source. If not set, the default configuration will be used.
Execute Command
vector --config log_vector.toml

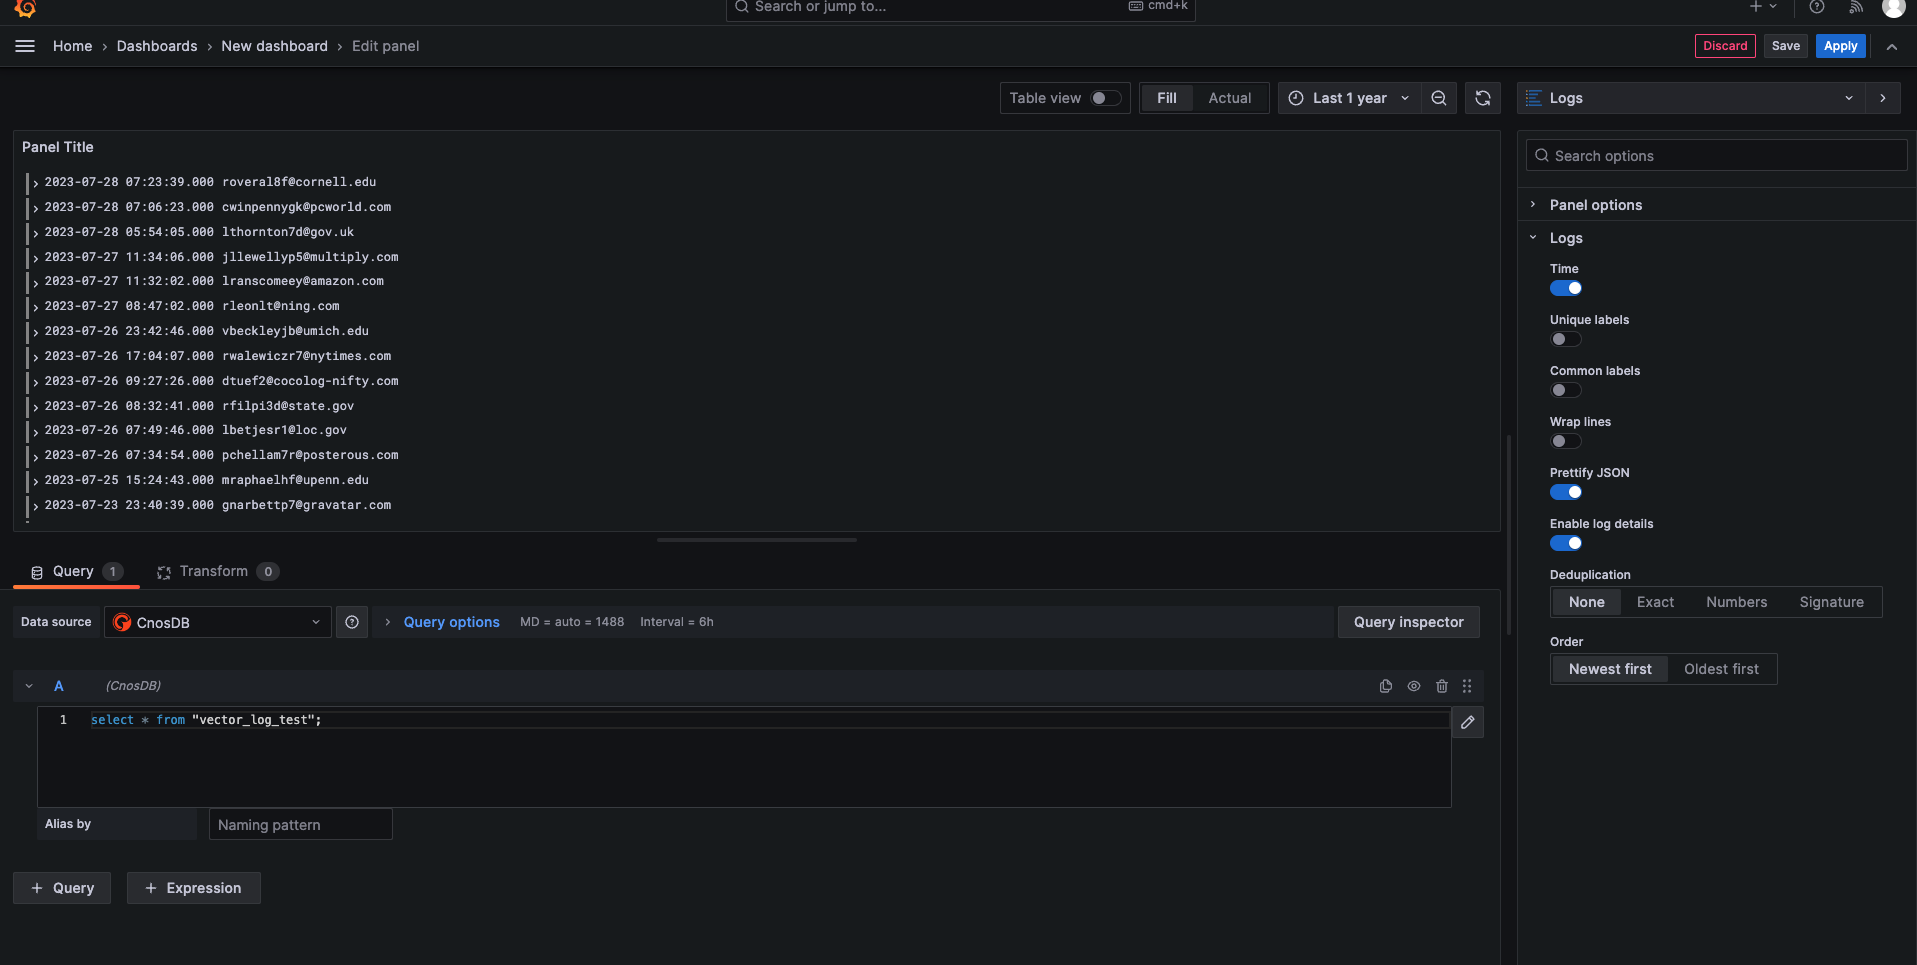
You can also use Grafana to view CnosDB log data
Write to Vector Metric
Example collection of metrics generated by Vector itself
The vector configuration file is as follows
[sources.example_metrics]
type = "internal_metrics"

[transforms.my_transform_id]
type = "remap"
inputs = [ "example_metrics" ]
source = """
# 与 Vector Log 类似,不同的是需要添加到 metric 的 tags 中,写入的 table 名为 metric 的 name 和 namespace(namespace.name),所以不需要指定 table 名
.tags._tenant = "cnosdb"
.tags._database = "public"
.tags._user = "root"
.tags._password = ""
"""

[sinks.cnosdb]
type = "vector"
inputs = ["my_transform_id"]
address = "127.0.0.1:8906"
It is important to note that, unlike the log type configuration file, parameters such as tenant, database, etc. need to be configured in .tags.
Execute Command
vector --config metric_vector.toml

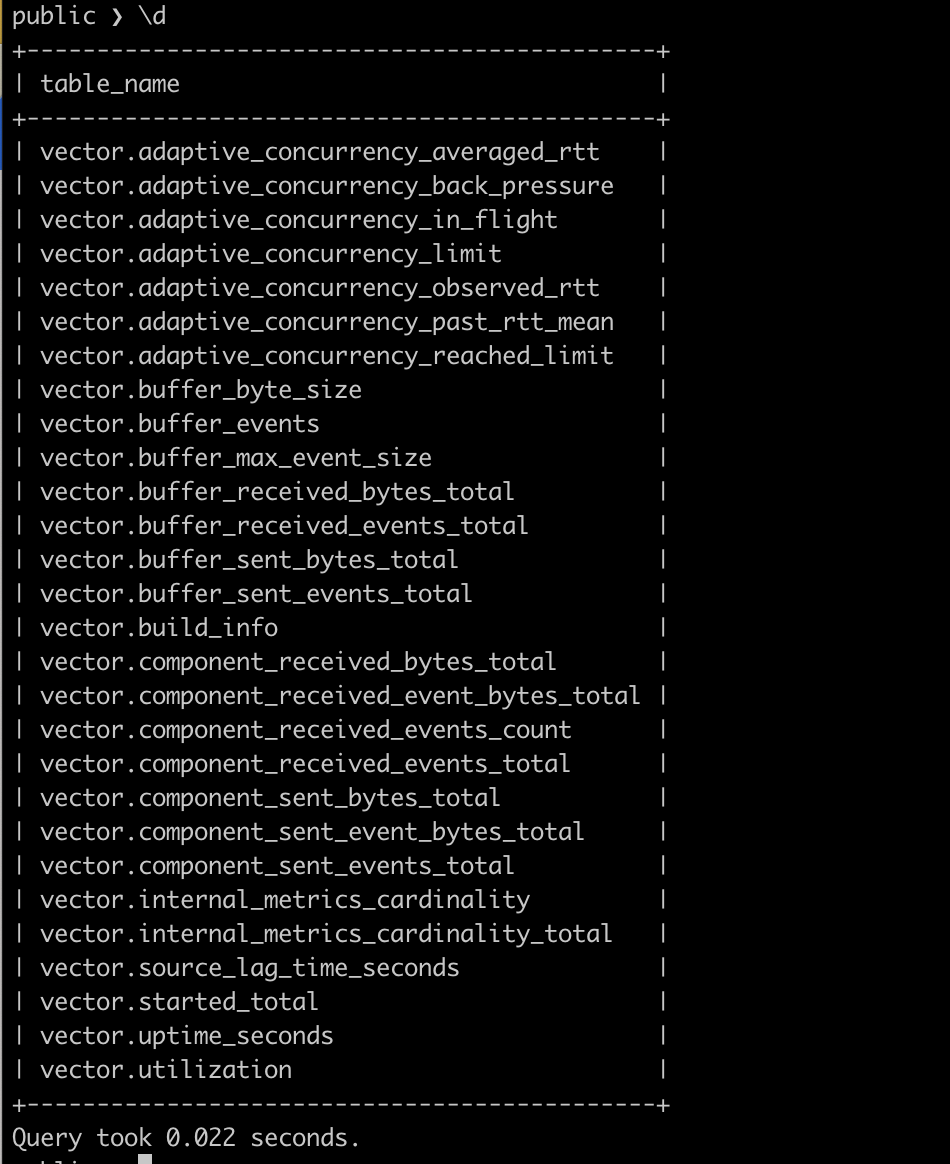
Use client to connect CnosDB for querying
Grafana Loki
Introduction to Promtail
Promtail is a log collection agent used to collect logs and send them to Loki.It is part of the Grafana Loki project. Grafana Loki is a horizontally scalable, highly available, multi-tenant log aggregation system designed specifically for storing and querying log data.Promtail is mainly responsible for collecting logs from various sources, processing them, and sending them to Grafana Loki.
'{"streams": [{ "stream": { "instance": "host123", "job": "app42" }, "values": [ [ "0", "foo fizzbuzz bar" ] ] }]}'
CnosDB Type Storage
The write interface of Promtail supported by CnosDB is: ip:port/api/v1/es/_bulk?table=t1&log_type=loki, the last two parameters cannot be omitted.
Start Process
Start CnosDB:
./target/debug/cnosdb run --config config/config_8902.toml -M singletonStart Promtail:
promtail --config.file=promtail-local-config.yaml
clients:
  - url: http://localhost:8902/api/v1/es/_bulk?table=t1&log_type=loki
    basic_auth:
      username: root
      password:
Elasticsearch
CnosDB Type Storage
The write interface is: ip:port/api/v1/es/_bulk?table=t1, the latter parameter cannot be omitted. For data in es format, CnosDB currently supports two types: index and create.
Introduction to Logstash
Logstash is an open-source data collection engine that can dynamically collect data from various sources, transform it into the desired format, and send it to the specified storage location.It is part of the Elastic Stack, used in conjunction with Elasticsearch and Kibana for centralizing, analyzing, and visualizing data.Logstash provides a customizable storage end. In the original data stream, Logstash will collect data from the corresponding data source, process it through the filter and processing flow in the configuration file, and output it to the corresponding storage end. Typically, it will output to Elasticsearch. With the correct configuration, it can also output to CnosDB for further processing.

Start Process
Start CnosDB:
./target/debug/cnosdb run --config config/config_8902.toml -M singletonStart Promtail:
./bin/logstash -f logstash.conf
output {
  elasticsearch {
    hosts => ["http://localhost:8902/api/v1/es/"]
    custom_headers => {
        Authorization => "Basic cm9vdDo="
    }
    parameters => {
      "table" => "t1"
    }
  }
}
Filebeat Introduction
Filebeat is a lightweight log collection processing tool (Agent), which is part of the Elasticsearch stack, written in the Golang language.Filebeat is designed to be installed on various nodes, read logs from the corresponding locations according to the configuration, and report them to designated places, such as Elasticsearch or Logstash.Filebeat is designed to consume fewer resources, suitable for collecting logs on servers, and has high reliability, ensuring that logs are reported at least once. At the same time, it considers possible issues in log collection, such as log offset continuation, file name changes, log truncation, etc.
Start Process
Start CnosDB:
./target/debug/cnosdb run --config config/config_8902.toml -M singletonStart Promtail:
./filebeat -c filebeat.yml
  output.elasticsearch:
    hosts: ["http://localhost:8902/api/v1/es/"]
    allow_older_versions: true
    username: "root"
    password: ""
    parameters:
      table: "t1"
ndjson
  {"date":"2024-03-27T02:51:11.687Z", "node_id":"1001", "operator_system":"linux", "msg":"test"}
  {"date":"2024-03-28T02:51:11.688Z", "node_id":"2001", "operator_system":"linux", "msg":"test"}'
Introduction to fluent-bit
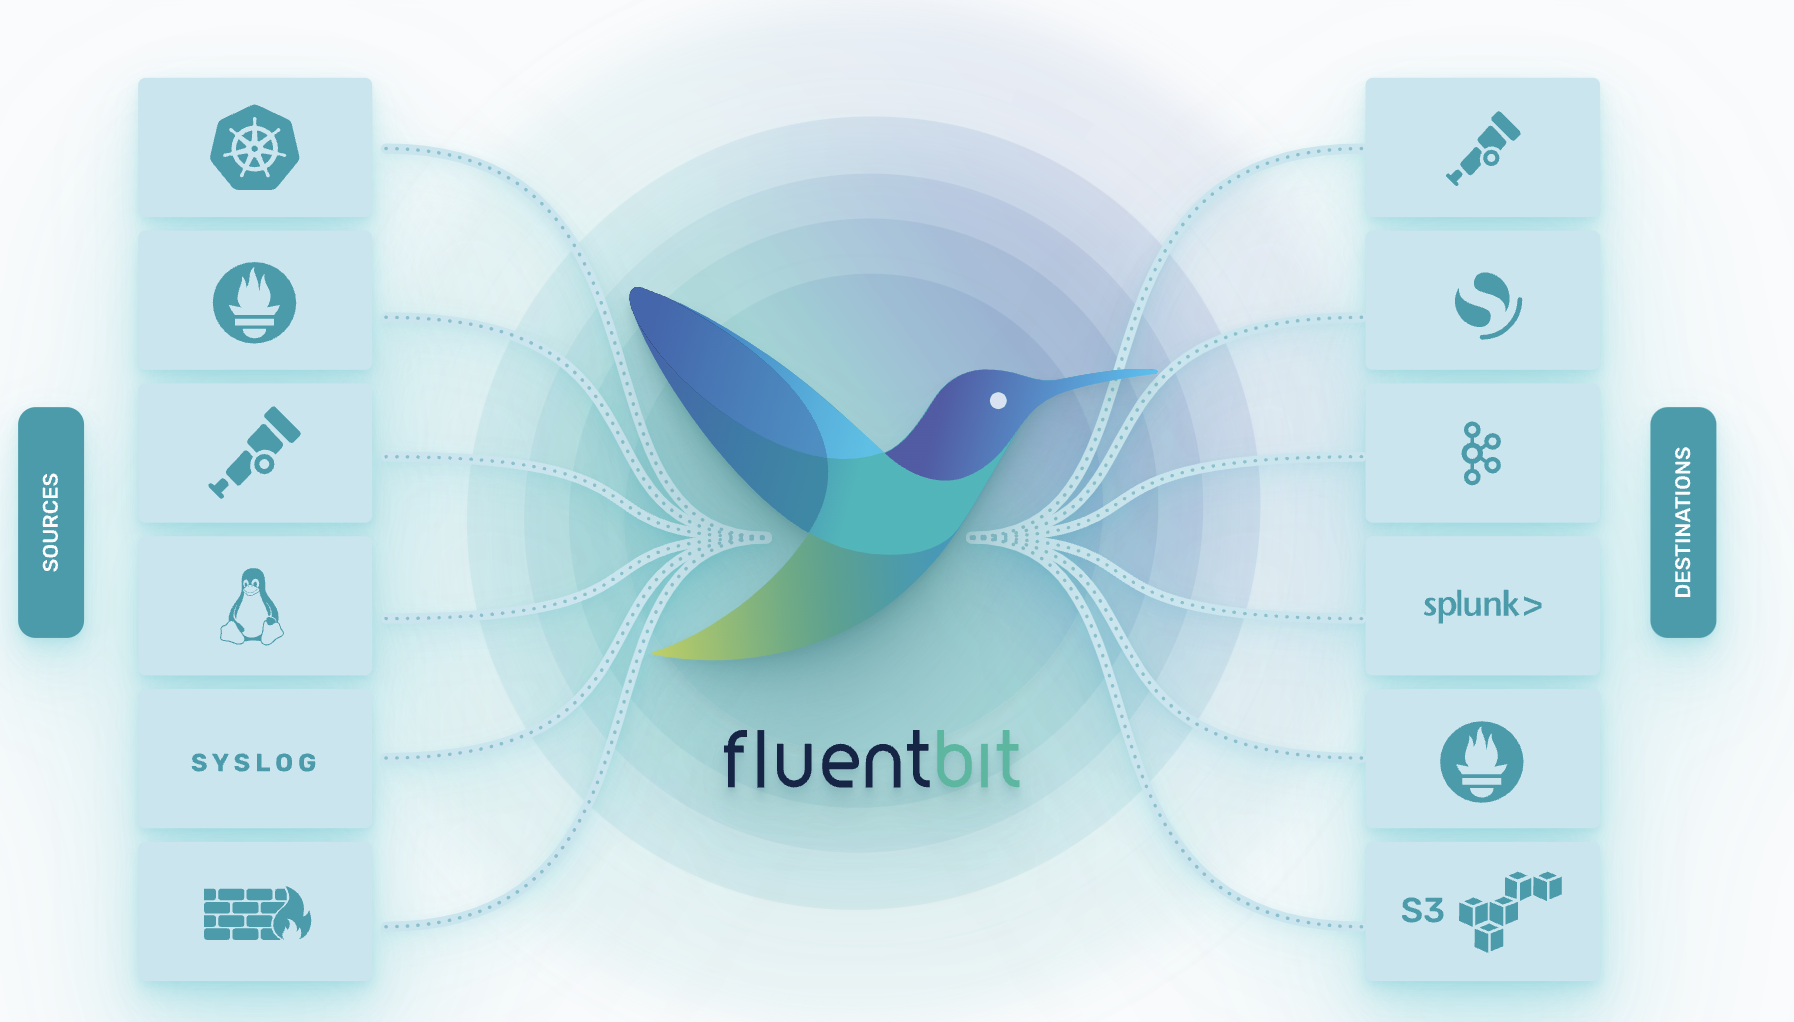
Fluent-bit is a lightweight log processing tool designed for resource-constrained environments such as embedded systems, containers, edge computing devices, etc.It is a sub-project of the Fluentd project, providing a flexible plugin system for collecting, processing, and transmitting log data.
Start Process
Start CnosDB:
./target/debug/cnosdb run --config config/config_8902.toml -M singletonStart Promtail:
fluent-bit -c fluent-bit.conf
  [OUTPUT]
    Name  http
    Match *
    Host  localhost
    Port  8902
    Format json_lines
    URI   /api/v1/es/_bulk?table=fluent&log_type=ndjson&time_column=date
    http_User root
    json_date_format iso8601
