Jaeger
Trace Introduction
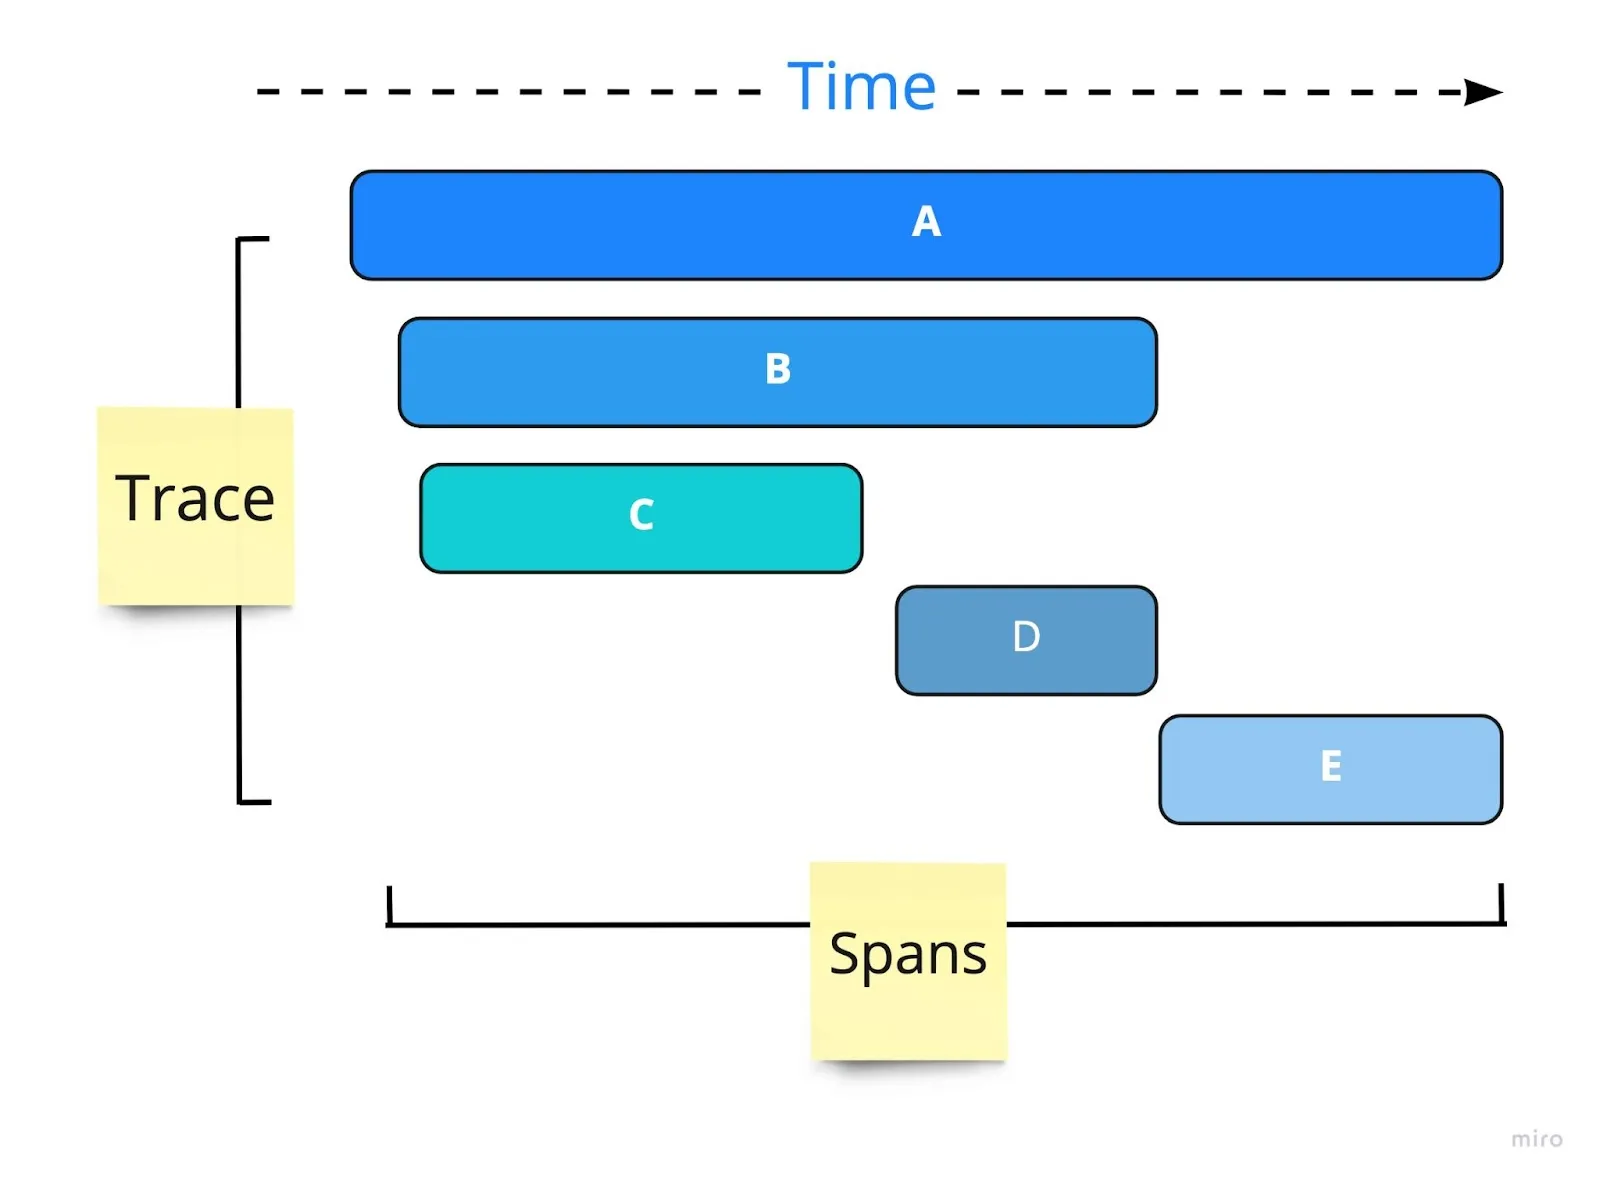
Trace, also known as Distributed link Tracking, is a technology used to record basic information (such as IP, appkey, methodological name) for all systems that have been requested to pass and intersystem calls (such as time-consuming, successful failure).As the microservice architecture prevails, a single network request may require the deployment of hundreds of microservice subsystems.Any microservice subsystem slows down the entire request process.With Trace provided with a map that we know that a slow request is a failure or a slow response to which node.This has been very helpful in our case of analytical performance.
CnosDB Match
CnosDB supports opentelemetry-proto writing and Jaeger visualization quiz, suitable for Grafana Jaeger plugin
opentelemetry-proto data writing
opentelemetry provides multiple language versions of export tools, you can use these tools to easily write trace data to CnosDB, to python version of the opentelemetry export tool as an example:
import base64
from time import sleep
from opentelemetry.sdk.resources import SERVICE_NAME, Resource

from opentelemetry import trace
from opentelemetry.exporter.otlp.proto.http.trace_exporter import OTLPSpanExporter
from opentelemetry.sdk.trace import TracerProvider
from opentelemetry.sdk.trace.export import BatchSpanProcessor

# Service name is required for most backends
resource = Resource(attributes={
    SERVICE_NAME: "test_service"
})
traceProvider = TracerProvider(resource=resource)

# 用户名和密码
username = "root"
password = ""

# 编码用户名和密码
credentials = f"{username}:{password}"
encoded_credentials = base64.b64encode(credentials.encode("utf-8")).decode("utf-8")

# 创建包含身份验证信息的头
headers = {
    "Authorization": f"Basic {encoded_credentials}",
    "tenant": "cnosdb",
    "db": "public",
    "table": "t1",
}

processor = BatchSpanProcessor(OTLPSpanExporter(
    endpoint="http://192.168.0.50:31902/api/v1/traces",
    headers=headers
))
traceProvider.add_span_processor(processor)

trace.set_tracer_provider(traceProvider)

for trace_index in range(10):
    tracer = trace.get_tracer(f"test_trace_{trace_index}")
    with tracer.start_as_current_span(f"trace_{trace_index}_parent_span") as parent_span:
         with tracer.start_as_current_span("child_span_1") as child_span_1:
               with tracer.start_as_current_span("child_span_2") as child_span_2:
                    tracer.start_as_current_span("child_span_3")

# 关闭TracerProvider以确保所有span都已经被导出
trace.get_tracer_provider().shutdown()
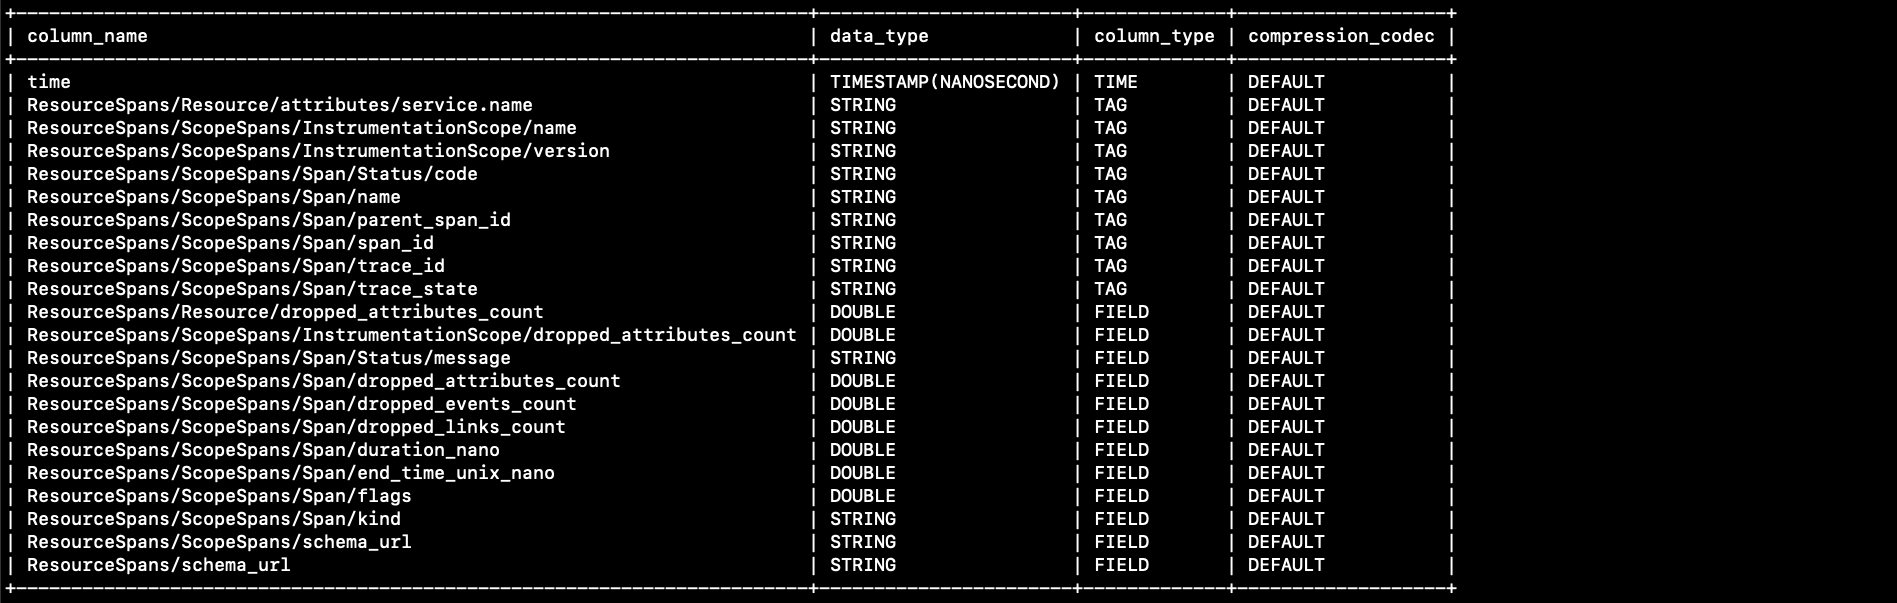
After successful import you can view the corresponding table structure in CnosDB, each row of the table indicates a Span:
Grafana Visualization Query
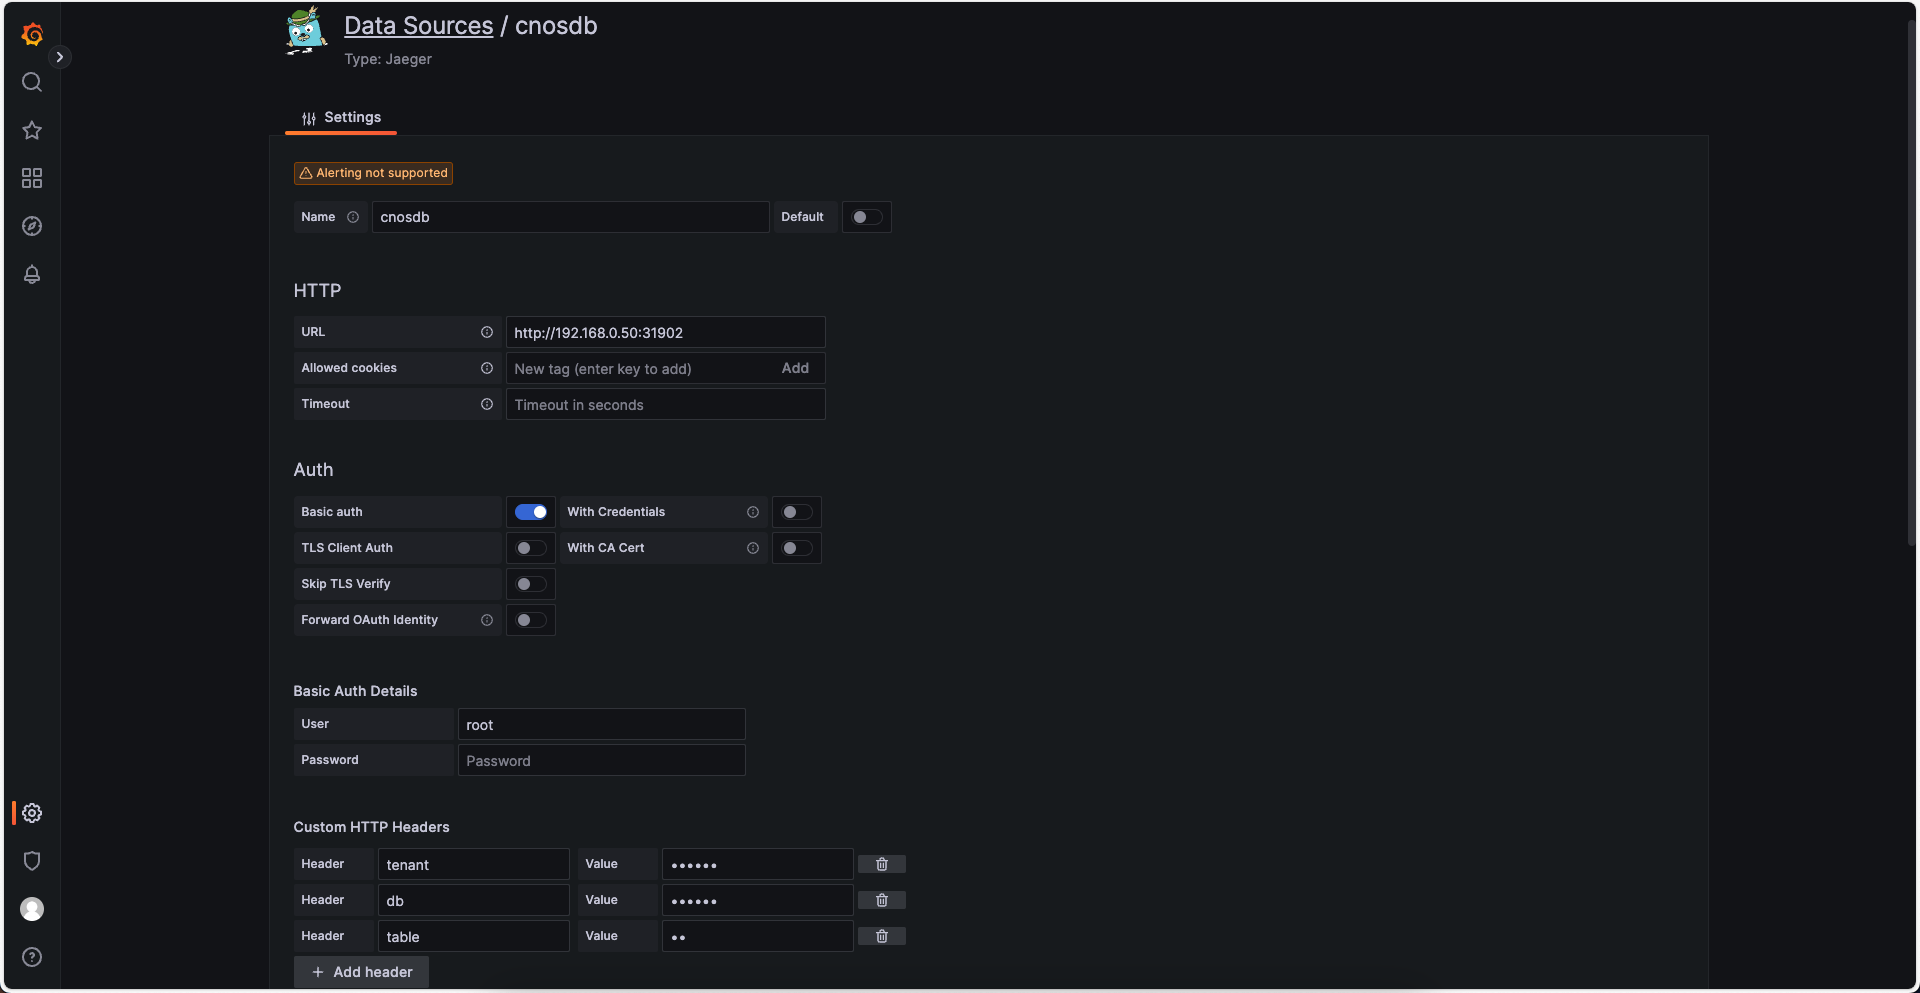
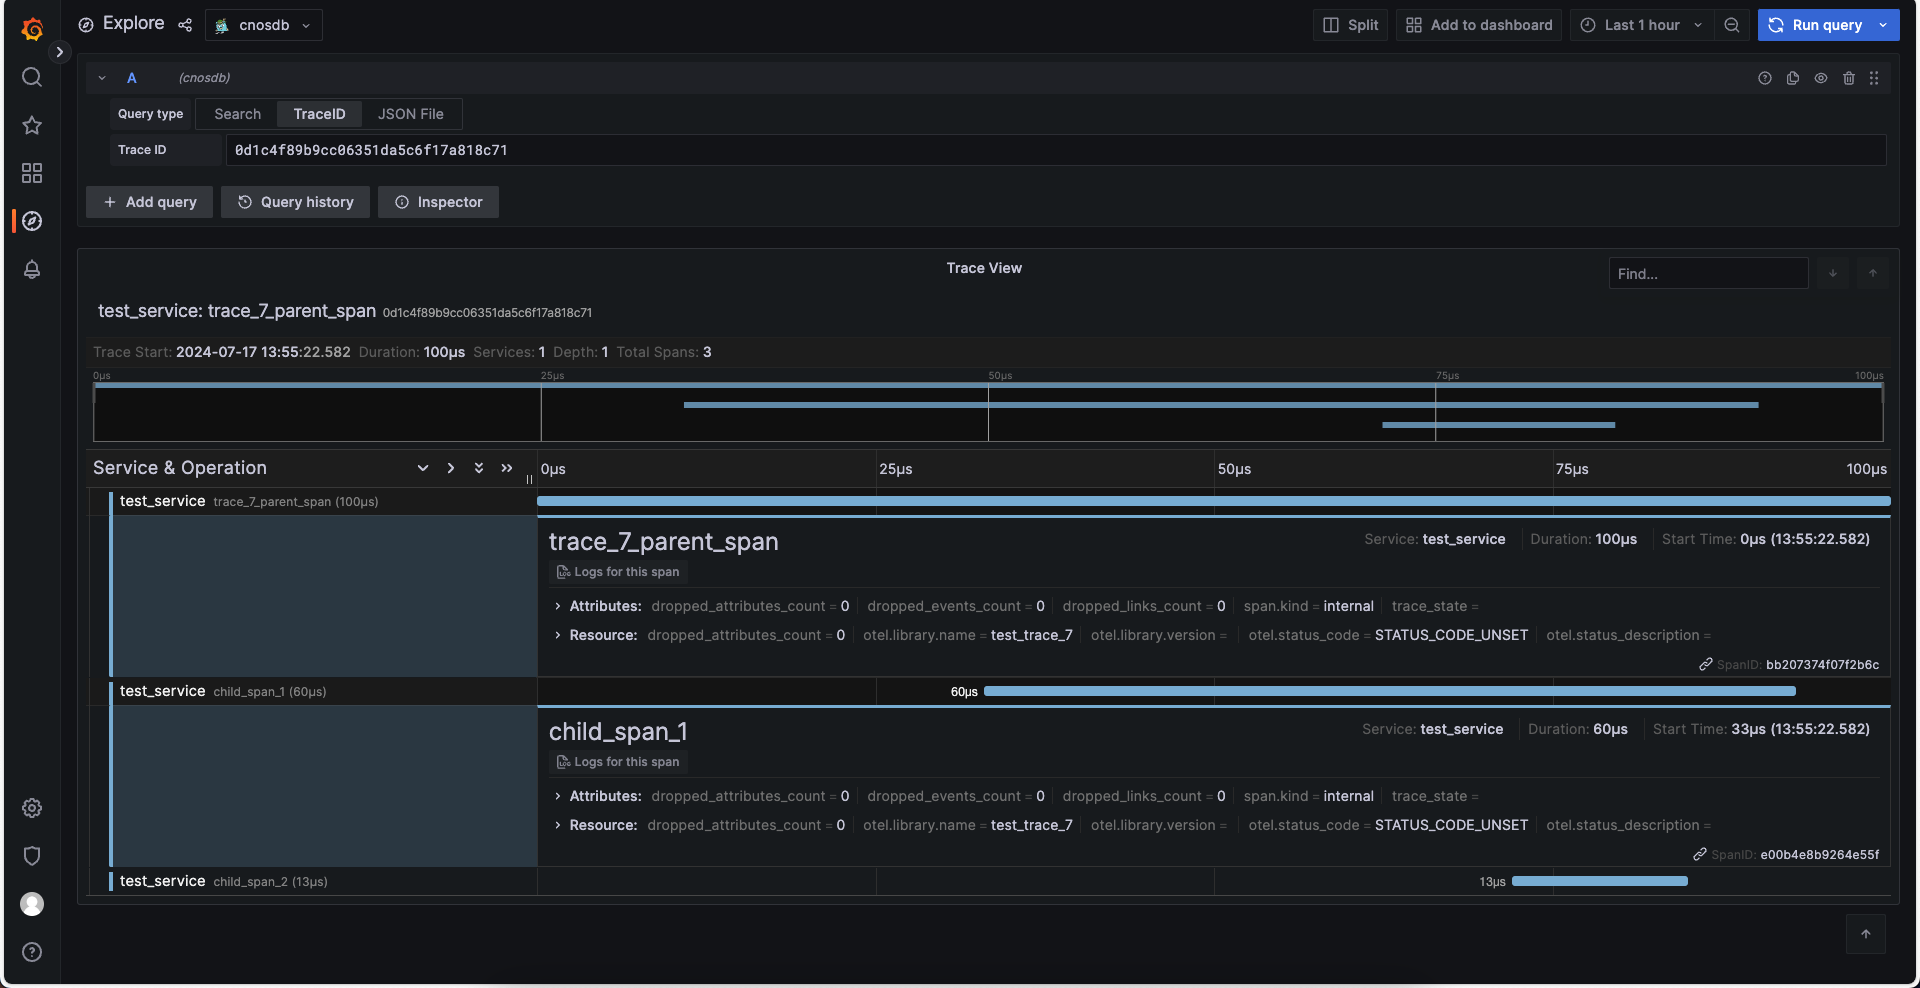
- Add a Jaeger plugin as a data source. Change it to the CnosDB address when configuring the Jaeger plugin, fill in the username code, fill in the tenant, db and table to query
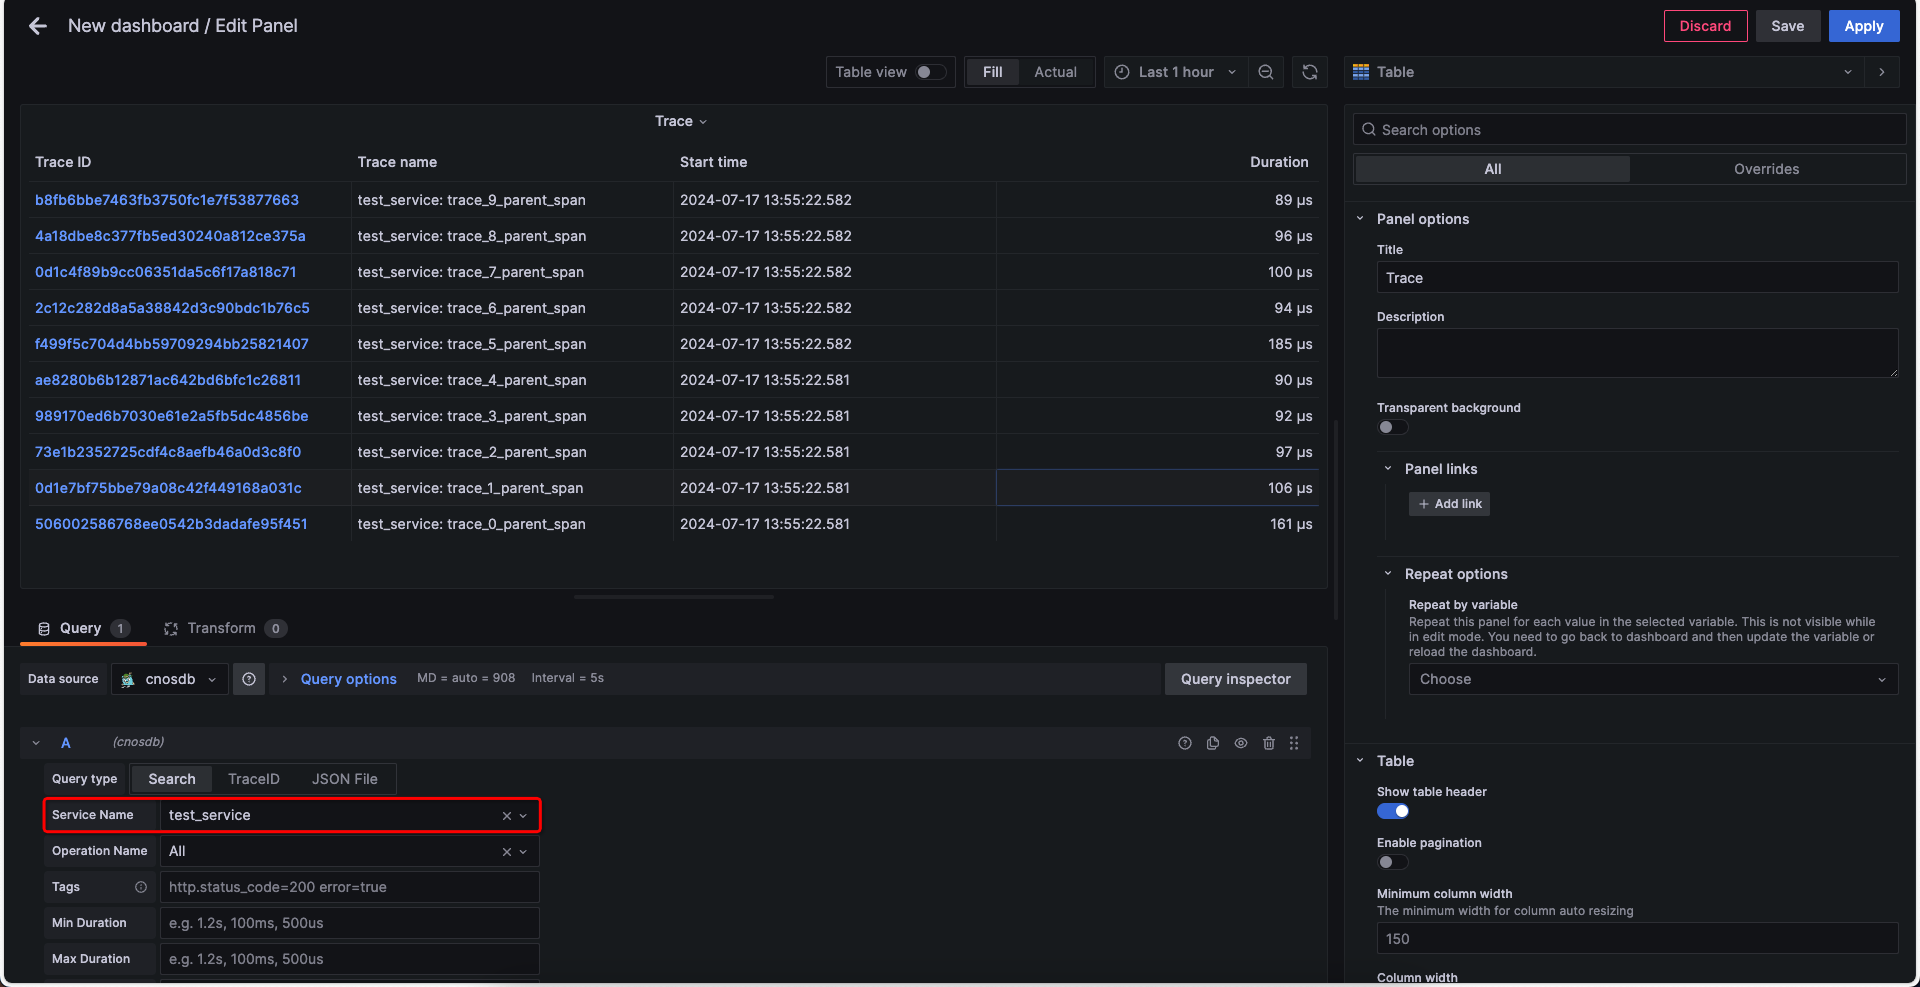
- After adding a data source, create the dashboard, specify the cnosdb as a data source and specify the service name to query traces under the service.Save dashboard
- Tap the traceid link to jump to the span diagram
Example
Deployed a demo to write to CnosDB in the ootlp trace, displayed through Grafana (username/password: user1/user1)