Monitor
Currently, CnosDB metrics can be collected by Prometheus or stored on CnosDB.
If you would like to see more metrics supported by CnosDB, please send an ISSUE to the repository.
Data Node Monitor Metrics
VNODE_DISK_STORAGE
Name
vnode_disk_storage
Category
Gauge
Description
The disk that the Vnode occupies.
Tag
| Field | Description |
|---|---|
| DATABASE | Database vnode belongs to |
| NODE_ID | ID of data node |
| TENANT | tenant vnode belongs to |
| VNODE_ID | ID of Vnode |
| VALUE | Disk that the Vnode occupies in bytes |
VNODE_CACHE_SIZE
Name
vnode_cache_size
Category
Gauge
Description
The cache size that vnode occupies in bytes.
Tag
| Field | Description |
|---|---|
| DATABASE | Database vnode belongs to |
| NODE_ID | ID of data node |
| TENANT | tenant vnode belongs to |
| VNODE_ID | ID of Vnode |
| VALUE | Cache that the Vnode occupies in bytes |
HTTP_DATA_IN
Name
http_data_in
Category
Count
Description
Data traffic written over http, excluding SQL.
Tag
| Field | Description |
|---|---|
| TIME | Time of record |
| DATABASE | Database name |
| NODE_ID | ID of data node |
| TENANT | Tenant name the database belongs to |
| VALUE | The total write traffic in Bytes |
HTTP_DATA_OUT
Name
http_data_out
Category
Count
Description
The size of the Http return data
Tag
| Field | Description |
|---|---|
| TIME | Time of record |
| DATABASE | Database name |
| NODE_ID | ID of data node |
| TENANT | Tenant name the database belongs to |
| Database | Database name |
| User | User name |
| VALUE | The total size of the read traffic in Bytes |
HTTP_QUERIES
Name
http_queries
Category
Count
Description
This metric keeps track of the number of Http queries a user makes.
Tag
| Field | Description |
|---|---|
| TIME | Time of record |
| DATABASE | Database name |
| NODE_ID | ID of data node |
| TENANT | Tenant name the database belongs to |
| USER | User name |
| VALUE | Query times |
HTTP_WRITES
Name
http_writes
Category
Count
Description
This metric records the number of times a user writes via Http.
Tag
| Field | Description |
|---|---|
| TIME | Time of record |
| DATABASE | Database name |
| NODE_ID | ID of data node |
| TENANT | Tenant name the database belongs to |
| USER | User name |
| VALUE | User write times |
HTTP_QUERY_DURATION
Name
http_query_duration
Category
Histogram
Description
Time spent querying through the Http interface.
Tag
| Field | Description |
|---|---|
| TIME | Time of record |
| DATABASE | Database name |
| NODE_ID | ID of data node |
| TENANT | Tenant name the database belongs to |
| USER | User name |
| LE | Less than this time, in ms |
| VALUE | Times |
HTTP_WRITE_DURATION
Name
http_write_duration
Category
Histogram
Description
Time taken to write through the Http interface.
Tag
| Field | Description |
|---|---|
| TIME | Time of record |
| DATABASE | Database name |
| NODE_ID | ID of data node |
| TENANT | Tenant name the database belongs to |
| USER | User name |
| LE | Less than this time, in ms |
| VALUE | Times |
COORD_DATA_IN
Name
coord_data_in
Category
Count
Description
Total size of the data accepted by the Coordinator when the data is written to the database.
Tag
| Field | Description |
|---|---|
| TIME | Time of record |
| DATABASE | Database name |
| NODE_ID | ID of data node |
| TENANT | Tenant name the database belongs to |
| VALUE | Data size in bytes |
COORD_DATA_OUT
Name
coord_data_out
Category
Count
Description
Total size of the data sent by the Coordinator when the data is read out of the database.
Tag
| Field | Description |
|---|---|
| TIME | Time of record |
| DATABASE | Database name |
| NODE_ID | ID of data node |
| TENANT | Tenant name the database belongs to |
| VALUE | Data size in bytes |
COORD_QUERIES
Name
coord_queries
Category
Count
Description
The number of times the data passes through the Coordinator during the query.
Tag
| Field | Description |
|---|---|
| TIME | Time of record |
| DATABASE | Database name |
| NODE_ID | ID of data node |
| TENANT | Tenant name the database belongs to |
| VALUE | Times |
COORD_WRITES
Name
coord_writes
Category
Count
Description
The number of times the data passes through the Coordinator during writing.
Tag
| Field | Description |
|---|---|
| TIME | Time of record |
| DATABASE | Database name |
| NODE_ID | ID of data node |
| TENANT | Tenant name the database belongs to |
| VALUE | Times |
SQL_DATA_IN
Name
sql_data_in
Category
Count
Description
The size of the data written via sql, including INSERT, COPY statements
Tag
| Field | Description |
|---|---|
| TIME | Time of record |
| DATABASE | Database name |
| NODE_ID | ID of data node |
| TENANT | Tenant name the database belongs to |
| VALUE | Data size in bytes |
HTTP_FLOW
Name
http_flow
Category
Count
Description
The sum of request body and response body accessed through the HTTP protocol
Tag
| Field | Description |
|---|---|
| time | Time of record |
| api | API name |
| host | Node's IP address |
| node_id | Node ID |
| value | Data size in bytes |
HTTP_RESPONSE_TIME
Name
http_response_time
Category
Histogram
Description
Time consumed by accessing via the HTTP protocol
Tag
| Field | Description |
|---|---|
| time | Time of record |
| api | API name |
| host | Node's IP address |
| le | Less than this time, in ms |
| node_id | Node ID |
| value | Times |
Meta Node Monitor Metrics
READ_META_COUNT
Name
read_meta_count
Category
Count
Description
Number of times meta is read
Tag
| Field | Description |
|---|---|
| time | Time of record |
| addr | Meta service address |
| node_id | Visit the node id of meta |
| value | Number of Reads |
READ_META_RESPONSE_TIME
Name
read_meta_response_time
Category
Histogram
Description
Time spent reading meta
Tag
| Field | Description |
|---|---|
| time | Time of record |
| addr | Meta service address |
| node_id | Visit the node id of meta |
| le | Less than this time, in ms |
| value | Times |
WRITE_META_COUNT
Name
write_meta_count
Category
Count
Description
Number of times meta is written
Tag
| Field | Description |
|---|---|
| time | Time of record |
| addr | Meta service address |
| node_id | Visit the node id of meta |
| value | Number of written |
WRITE_META_RESPONSE_TIME
Name
write_meta_response_time
Category
Histogram
Description
Time spent writing meta
Tag
| Field | Description |
|---|---|
| time | Time of record |
| addr | Meta service address |
| node_id | Visit the node id of meta |
| le | Less than this time, in ms |
| value | Times |
WATCH_META_COUNT
Name
watch_meta_count
Category
Count
Description
Number of times meta is read
Tag
| Field | Description |
|---|---|
| time | Time of record |
| addr | Meta service address |
| node_id | Visit the node id of meta |
| value | Visits |
WATCH_META_RESPONSE_TIME
Name
watch_meta_response_time
Category
Histogram
Description
Time spent accessing meta
Tag
| Field | Description |
|---|---|
| time | Time of record |
| addr | Meta service address |
| node_id | Visit the node id of meta |
| le | Less than this time, in ms |
| value | Times |
RAFT_APPLIED_INDEX
Name
raft_applied_index
Category
Gauge
Description
The Raft state machine of each node should apply the latest index
Tag
| Field | Description |
|---|---|
| TIME | Time of record |
| DATABASE | Database name |
| NODE_ID | ID of data node |
| TENANT | Tenant name the database belongs to |
| REPLICA_ID | Duplicate group ID |
| VNODE_ID | The represented Raft node ID |
| VALUE | Index corresponding to Entry |
RAFT_FLUSHED_INDEX
Name
raft_flushed_index
Category
Gauge
Description
The data of each node has been flushed to the index corresponding to the disk
Tag
| Field | Description |
|---|---|
| TIME | Time of record |
| DATABASE | Database name |
| NODE_ID | ID of data node |
| TENANT | Tenant name the database belongs to |
| REPLICA_ID | Duplicate group ID |
| VNODE_ID | The represented Raft node ID |
| VALUE | Index corresponding to Entry |
RAFT_RAPLICATION_DELAY
Name
raft_replication_delay
Category
Gauge
Description
Synchronize data differences with the Leader for each node
Tag
| Field | Description |
|---|---|
| TIME | Time of record |
| DATABASE | Database name |
| NODE_ID | ID of data node |
| TENANT | Tenant name the database belongs to |
| REPLICA_ID | Duplicate group ID |
| VNODE_ID | The represented Raft node ID |
| VALUE | The difference in number of bars with Leader |
RAFT_SNAPSHOT_INDEX
Name
raft_snapshot_index
Category
Gauge
Description
Index of the latest snapshot corresponding to each Raft node
Tag
| Field | Description |
|---|---|
| TIME | Time of record |
| DATABASE | Database name |
| NODE_ID | ID of data node |
| TENANT | Tenant name the database belongs to |
| REPLICA_ID | Duplicate group ID |
| VNODE_ID | The represented Raft node ID |
| VALUE | Index corresponding to snapshot |
RAFT_WAL_INDEX_MAX
Name
raft_wal_index_max
Category
Gauge
Description
Maximum Index of current wal for each Raft node
Tag
| Field | Description |
|---|---|
| TIME | Time of record |
| DATABASE | Database name |
| NODE_ID | ID of data node |
| TENANT | Tenant name the database belongs to |
| REPLICA_ID | Duplicate group ID |
| VNODE_ID | The represented Raft node ID |
| VALUE | Wal current Minimum Index |
RAFT_WAL_INDEX_MIN
Name
raft_wal_index_min
Category
Gauge
Description
Minimum Index of current wal for each Raft node
Tag
| Field | Description |
|---|---|
| TIME | Time of record |
| DATABASE | Database name |
| NODE_ID | ID of data node |
| TENANT | Tenant name the database belongs to |
| REPLICA_ID | Duplicate group ID |
| VNODE_ID | The represented Raft node ID |
| VALUE | Wal current Minimum Index |
Prometheus Monitor
Just add Job at the Prometheus configuration file.
scrape_configs:
  # The job name is added as a label `job=<job_name>` to any timeseries scraped from this config.
  - job_name: 'cnosdb'
    static_configs:
      - targets: [ '127.0.0.1:8902' ]
Parameter Description
targets is the adderss of CnosDB Http.
Store to CnosDB
Change the store_metrics in config to true.
Jaeger
Enable Jaeger support in CnosDB
Cancel [trace] configuration annotation to enable Jaeger tracking feature.
Note: Restarting the service is required for the configuration to take effect.
[trace]
auto_generate_span = true
otlp_endpoint = 'http://localhost:4317'
Install and start Jaeger
For other deployment methods, please refer to the Jaeger deployment documentation
docker run -d --name jaeger \
-p 4317:4317 \
-p 16686:16686 \
jaegertracing/all-in-one:latest
After successful start-up, access http://127.0.0.1:16686 using a browser.
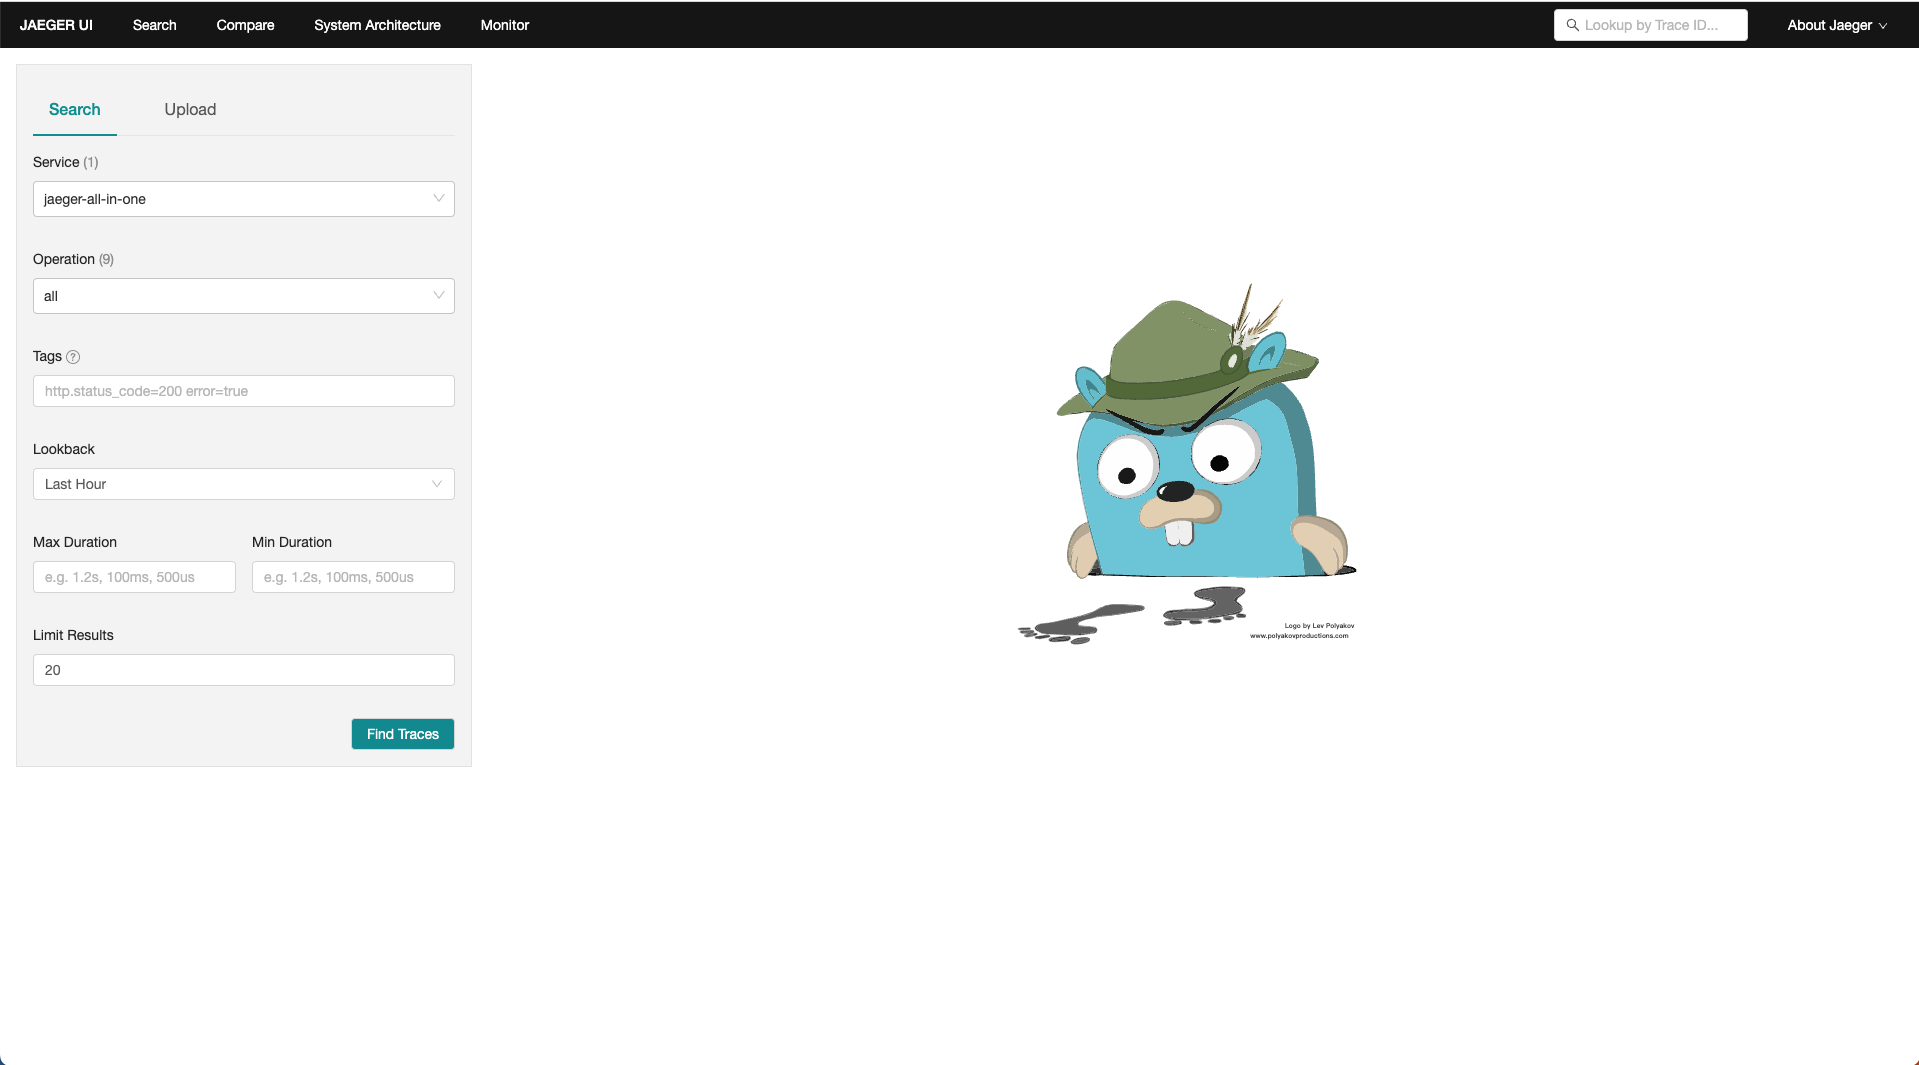
Track events in CnosDB
- Add
span contextin the request.
auto_generate_span = truecan be set in the configuration file to generate automatically. If you need to analyze specific statements, please customize thecnosdb-trace-ctxvalue in the request, in the following format (cnosdb-trace-ctx: {trace-id}:{span-id}).
cnosdb-trace-ctx: 3a3a43:432e345
Example:
For the data source of the example, please refer to: https://docs.cnosdb.com/en/latest/start/quick_start Query the data in the
airtable of theoceanic_stationdatabase, and sort it in descending order by time, returning the top 5 records.
curl -i -u "root:" -H "Accept: application/json" -H "cnosdb-trace-ctx: 3a3a43:432e345" -XPOST "http://127.0.0.1:8902/api/v1/sql?db=oceanic_station&pretty=true" -d "select * from air order by time desc limit 5;"
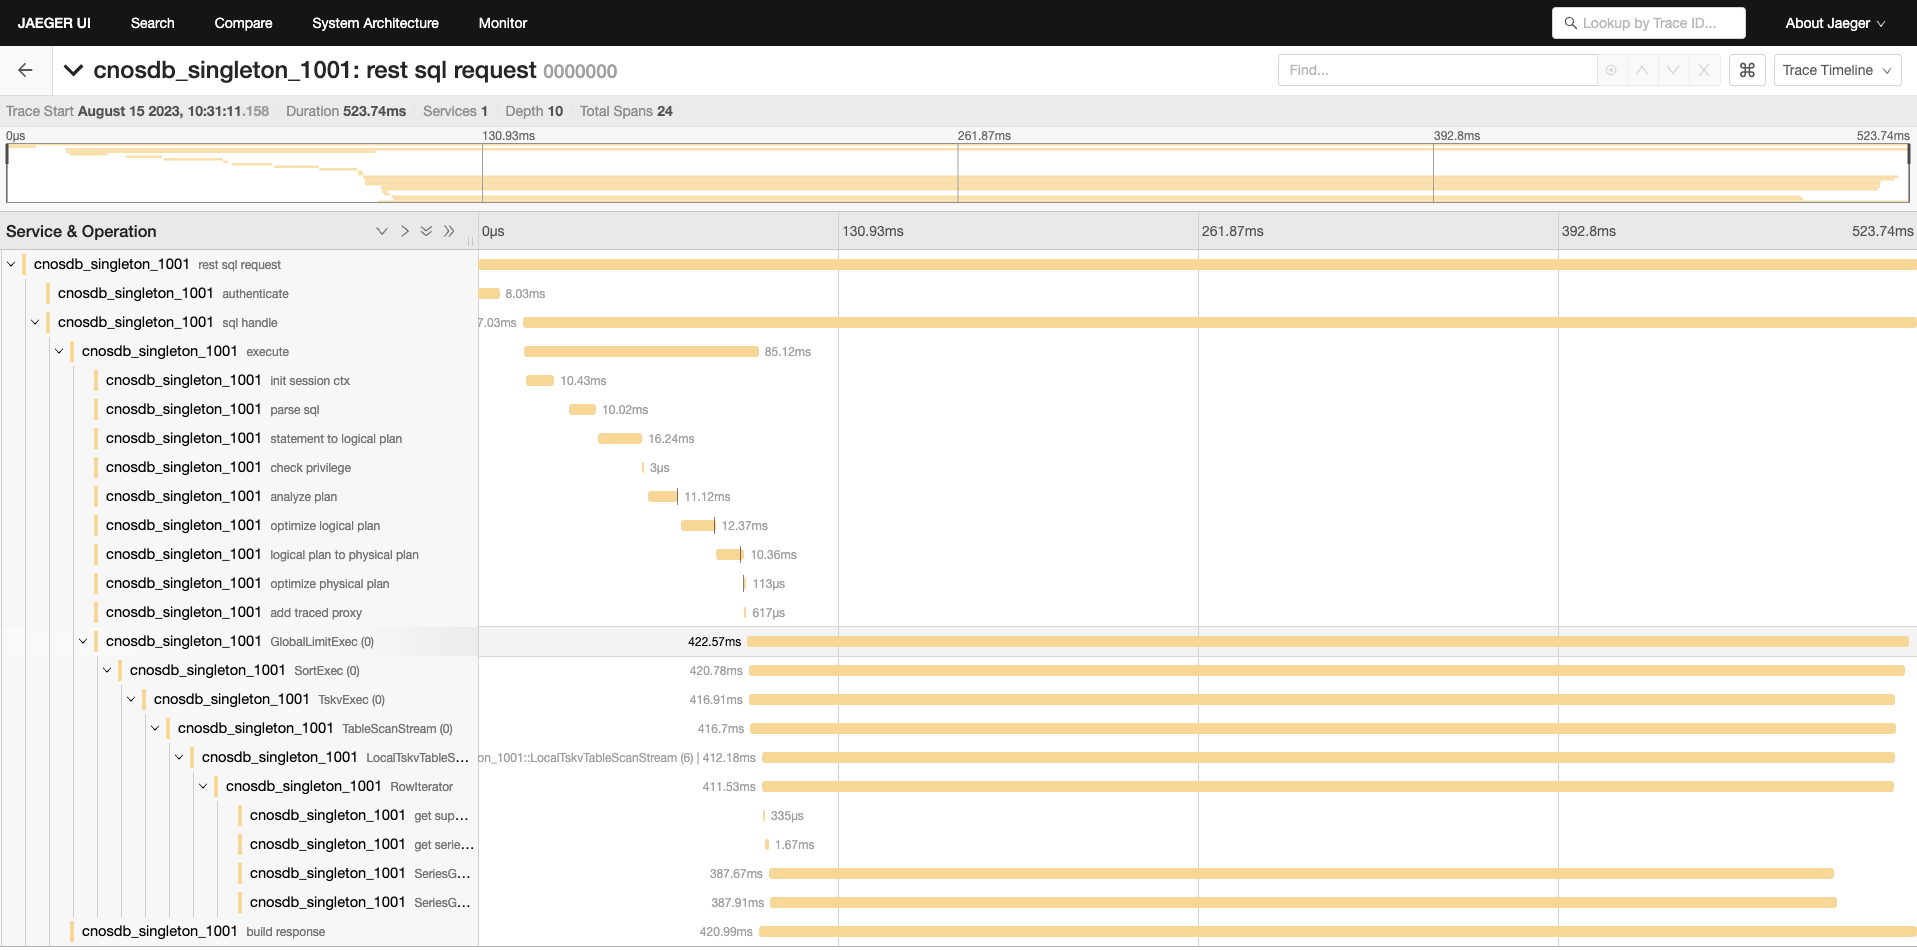
Analyzing with a dashboard
- Record Span:
When a client application sends a query or write request to the CnosDB database, CnosDB sends the generated Span record to Jaeger.Each span represents a stage of the request, including processing time, operation name, and other relevant information.
- Select Service:
In the Service dropdown menu in the Jaeger user interface, select the service related to CnosDB (for example: cnosdb_singleton_1001).
- Find Traces:
On the interface, click the "Find Traces" button, and the system will retrieve all traces related to the selected service.This will display a series of requests and corresponding spans.
- Analyze Trace details:
Click on the trace of interest to enter the detailed view.In this view, you will see the entire process of the request, as well as the time each span takes to execute.These time information will help you understand the time spent on each step of the query processing.
- Optimize queries and systems:
By using detailed time records, you can accurately analyze the performance of query statements.In a formal production environment, this will become a valuable tool for optimizing query statements and improving system performance.By analyzing the execution time of each span, you can identify the steps that may cause delays, and take targeted optimization measures.
In addition, Jaeger can also track other events of CnosDB, please see: ISSUE 1272