告警管理
仅企业版支持,获取告警组件请联系 CC
介绍
CnosDB 支持告警管理,通过 CnosDB 告警管理,您可以查看告警信息、设置告警通知方式、设置告警规则、设置告警通知组等。
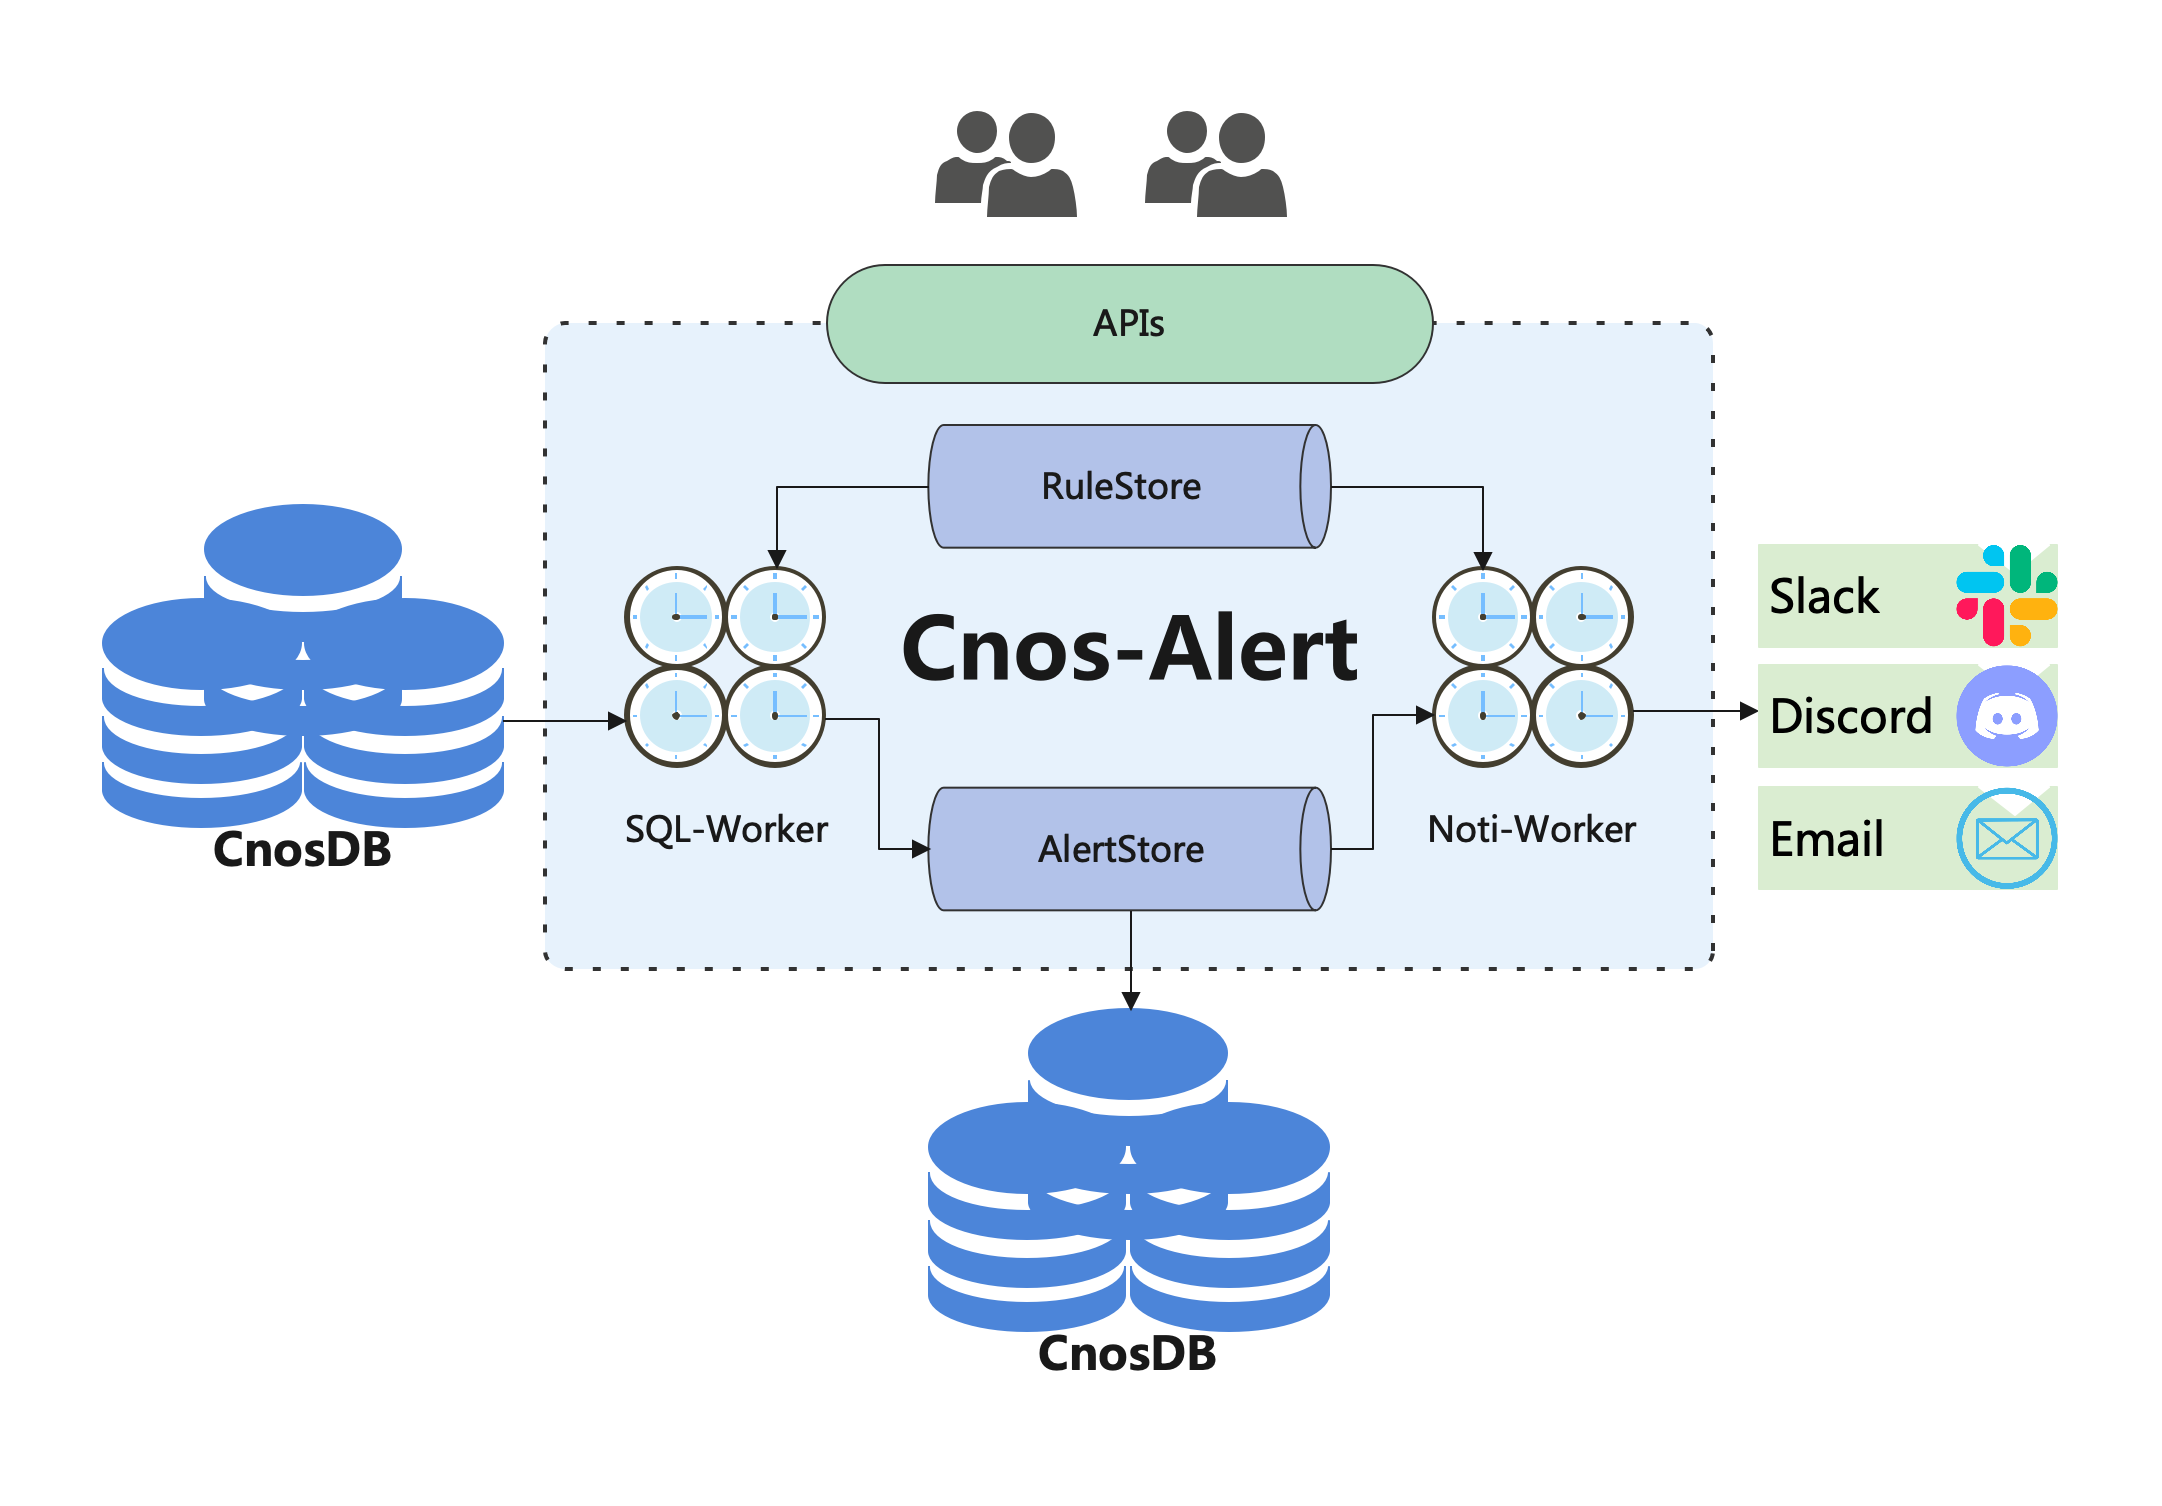
实现原理
cnos-alert组件针对存储在CnosDB中时序数据,根据用户提交的配置文件,定时执行sql查询,对查询结果与阈值比对,将触发告警的查询结果发送至用户指定接收终端。
sql查询:
标准的cnosdb-sql查询语句,考虑到告警的使用场景,一般都是带有time相关where子句。
阈值:
配置时需要指定sql查询返回值的一个字段,为这个字段设置一个触发告警的阈值,目前支持大于、小于、等于、区间内、区间外五类阈值形式。
通知接收终端:
目前支持slack、twitter两种。
历史记录:
所有触发告警的查询结果、发出的通知都将记录在cnosdb中。
用户配置的告警规则记录在用户指定位置json文件中。
启动
./alertserver --config=alertserver.yaml --serverport=9001
配置(alertserver.yaml)
query: #被查询数据所在cnosdb配置
    nodeHost: 127.0.0.1
    nodePort: 8902
    authorization: ********* #仅支持base64加密后的用户名密码
alert: #告警规则配置持久化配置
    filePath: /etc/alert.json
store: #告警、通知记录保存所在cnosdb配置
    nodeHost: 127.0.0.1
    nodePort: 8902
    authorization: ********* #仅支持base64加密后的用户名密码
    alerttable:  alertrecord #告警记录表名
    notitable: notirecord #通知记录表明
API 接口描述
/api/http/ping
描述
测试服务运行状态
请求方法
- GET
请求示例
curl -X GET http:/127.0.0.1:30001/api/http/ping
请求成功
{"message":"ok"}
请求失败
curl: error
/api/v1/alert/config/rule
描述
创建一条告警规则
请求方法
- POST
请求示例
curl -X POST http:/127.0.0.1:30001/api/v1/alert/config/rule
请求参数
{
    "tenant": "cnosdb", # 被查询数据所在cnosdb中的租户
    "data": {
        "enabled": "on", # 告警规则的初始执行状态,【“on”, “off“】
        "dbname": "public", #  被查询数据所在数据库
        "sqlType": 1, # 选择sql类型,目前支持参数值为1,使用sqlCmd参数中的cnsodb sql进行查询。后续扩展会支持其他类型的sql语法。
        "sqlCmd": "select cpu, avg(usage_user) from cpu where time >= now() - interval '20' SECOND group by cpu", # 与sqlType 1配合使用
        "period": "15s", # 查询执行周期,由数字➕ 【‘s',’m‘,’h‘,’d‘】组成
        "thresholds": [ # 阈值设置
            {
                "checks": [ # 查询结果需要进行的检查
                    {
                        "value": "0.2", # 一个比较值
                        "operator": 1 # 一个比较运算,-2: 小于等于, -1: 小于, 0: 等于, 1: 大于, 2: 大于等于
                    }
                ],
                "period": "Automation", # 通知任务执行周期,【’Automation', 'Hourly', 'Daily','Weekly'],其中Automation为一分钟一次
                "severity": "Medium", # 告警级别
                "endtools": [ # 接收终端
                    {
                        "name": "slack", # 终端命名
                        "receiver": "https://hooks.slack.com/services/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", # slack需要用户提供webhookurl,twitter则需要用户提供校验key
                        "format": "", # 配置通知内容的格式,具体参考后续示例
                        "tool": "slack" # 终端类型
                    }
                ],
                "checkrelation": 0 # checks可以有多个,通过relation确定check之间的逻辑关系,0为或运算,1为与运算
            }
        ],
        "name": "cpu new", # rule名字
        "description": "cpu local demo", # 描述
        "field": "AVG(cpu.usage_user)", # 查询结果被用来比较的字段
    }
}
请求成功
{
    "message":"succeed",
    "id":"1"
}
请求失败
{
    "code":3,
    "message":"invalid character '}' looking for beginning of object key string",
    "details":[]
}
/api/v1/alert/config/rule
描述
修改一条告警规则
请求方法
- PUT
请求示例
curl -X PUT http:/127.0.0.1:30001/api/v1/alert/config/rule
请求参数
{
    "id": 1, # rule的id
    "tenant": "cnosdb", # 被查询数据所在cnosdb中的租户
    "data": {
        "enabled": "on", # 告警规则的初始执行状态,【“on”, “off“】
        "dbname": "public", #  被查询数据所在数据库
        "sqlType": 1, # 选择sql类型,本地推荐 1,使用sqlCmd参数中的完整sql进行查询
        "sqlCmd": "select cpu, avg(usage_user) from cpu where time >= now() - interval '20' SECOND group by cpu", # 与sqlType 1配合使用
        "period": "15s", # 查询执行周期,由数字➕ 【‘s',’m‘,’h‘,’d‘】组成
        "thresholds": [ # 阈值设置
            {
                "checks": [ # 查询结果需要进行的检查
                    {
                        "value": "0.2", # 一个比较值
                        "operator": 1 # 一个比较运算,-2: 小于等于, -1: 小于, 0: 等于, 1: 大于, 2: 大于等于
                    }
                ],
                "period": "Automation", # 通知任务执行周期,【’Automation', 'Hourly', 'Daily','Weekly'],其中Automation为一分钟一次
                "severity": "Medium", # 告警级别
                "endtools": [ # 接收终端
                    {
                        "name": "slack", # 终端命名
                        "receiver": "https://hooks.slack.com/services/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", # slack需要用户提供webhookurl,twitter则需要用户提供校验key
                        "format": "", # 配置通知内容的格式,具体参考后续示例
                        "tool": "slack" # 终端类型
                    }
                ],
                "checkrelation": 0 # checks可以有多个,通过relation确定check之间的逻辑关系,0为或运算,1为与运算
            }
        ],
        "name": "cpu new", # rule名字
        "description": "cpu local demo", # 描述
        "field": "AVG(cpu.usage_user)", # 查询结果被用来比较的字段
    }
}
请求成功
{ "message":"succeed" }
请求失败
{
    "code": error id,
    "message": error string,
    "details":[]
}
api/v1/alert/config/rule/tenant/:tenant/id/:id
描述
获取指定rule的信息
请求方法
- GET
请求示例
curl -X GET http:/127.0.0.1:30001/api/v1/alert/config/rule/tenant/cnosdb/id/1
请求参数
    :tenant: 租户
    :id: rule id
请求成功
{
    "id": "1",
    "data":{
        "enabled": "off",
        "dbname": "public",
        "sql": null,
        "period": "15s",
        "thresholds": [
            {
                "checks": [
                    {
                        "value": "0.2",
                        "operator": 1
                    }
                ],
                "period": "Automation",
                "severity": "Medium",
                "endtools":[
                    {
                        "name": "slack",
                        "receiver": "https://hooks.slack.com/services/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", "format": "",
                        "tool": "slack"
                        }
                    ],
                "checkrelation": 0
            }
        ],
        "name": "cpu new",
        "description": "cpu local demo",
        "field": "AVG(cpu.usage_user)",
        "create": "2023-08-17T10:45:02+08:00",
        "latestupdate": "2023-08-17T11:24:43+08:00",
        "lateststatus": "0",
        "additionalRetrospectiveTime": "",
        "sqlType": "1",
        "sqlCmd": "select cpu, avg(usage_user) from cpu where time >= now() - interval '20' SECOND group by cpu"
        }
    "tenant": "cnosdb"
}
请求失败
{
    "code": error id,
    "message": error string,
    "details":[]
}
api/v1/alert/config/rule/tenant/:tenant/id/:id
描述
删除置顶rule
请求方法
- DELETE
请求示例
curl -X DELETE http:/127.0.0.1:30001/api/v1/alert/config/rule/tenant/cnosdb/id/1
请求参数
    :tenant: 租户
    :id: rule id
请求成功
{
    "message": "succeed"
}
请求失败
{
    "code": error id,
    "message": error string,
    "details":[]
}
/api/v1/alert/config/rule/tenant/:tenant
描述
列出指定租户下所有rule
请求方法
- GET
请求示例
curl -X DELETE http:/127.0.0.1:30001/api/v1/alert/config/rule/tenant/cnosdb?page=1&per_page=10
请求参数
    :tenant: 租户
    page: 页数
    per_page: 每页展示记录数量
请求成功
{
    "data":[
        {
            "name": "cpu new", # rule name
            "severity": "Medium", # rule 级别
            "lastrun": "2023-08-17T11:51:04+08:00", # sql查询最后一次执行时间
            "enabled": "on",  # rule状态
            "laststatus": "0", # 最后一次执行状态,0表示失败,1表示成功
            "id": 2 # rule id
            }
        ],
    "order": "name, severity, lastrun, laststatus, enabled", # 本地无需关心
    "total": "1" # 租户下rule总量
}
请求失败
{
    "code": error id,
    "message": error string,
    "details":[]
}
api/v1/alert/data/alert/tenant/:tenant
描述
列出指定租户下所有alert记录
请求方法
- GET
请求示例
curl -X DELETE http:/127.0.0.1:30001/api/v1/alert/data/alert/tenant/cnosdb?page=1&per_page=10
请求参数
    :tenant: 租户
    page: 页数
    per_page: 每页展示记录数量
请求成功
{
    "data": "[{\"enabled\":1,\"name\":\"cpu new\",\"severity\":\"Medium\",\"time\":\"2023-06-27T09:49:08.441665430\",\"value\":\"{\\\"AVG(cpu.usage_user)\\\":0.2001001001000161,\\\"cpu\\\":\\\"cpu2\\\"}\"}]", # alert记录 json字符串
    "order": "time, name, severity, value, enabled",  # 本地可无视
    "total": "628" # alert总量
}
请求失败
{
    "code": error id,
    "message": error string,
    "details":[]
}
api/v1/alert/data/noti/tenant/:tenant
描述
列出指定租户下所有通知记录
请求方法
- GET
请求示例
curl -X DELETE http:/127.0.0.1:30001/api/v1/alert/data/noti/tenant/cnosdb?page=1&per_page=10
请求参数
    :tenant: 租户
    page: 页数
    per_page: 每页展示记录数量
请求成功
{
    "data": "[{\"name\":\"cpu new\",\"send_status\":1,\"severity\":\"Medium\",\"time\":\"2023-06-27T09:27:08\",\"value\":\"{\\\"AVG(cpu.usage_user)\\\":0.20040080160339818,\\\"cpu\\\":\\\"cpu1\\\"}\\n{\\\"AVG(cpu.usage_user)\\\":0.3000000000020009,\\\"cpu\\\":\\\"cpu3\\\"}\\n{\\\"AVG(cpu.usage_user)\\\":0.20026912240306194,\\\"cpu\\\":\\\"cpu-total\\\"}\\n{\\\"AVG(cpu.usage_user)\\\":0.3501002004075616,\\\"cpu\\\":\\\"cpu0\\\"}\\n{\\\"AVG(cpu.usage_user)\\\":0.2999999999974534,\\\"cpu\\\":\\\"cpu2\\\"}\"}]", # noti记录 json字符串
    "order": "time, name, severity, value, send_status", # 本地可无视
    "total": "35" # 总量
}
请求失败
{
    "code": error id,
    "message": error string,
    "details":[]
}
示例
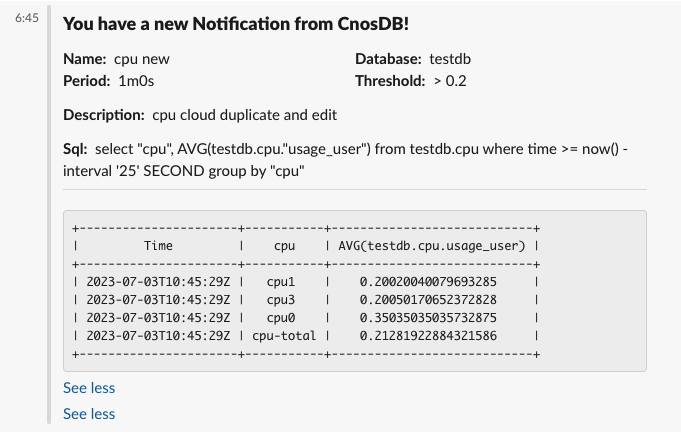
假设我们通过telegraf工具向cnosdb中写入了cpu的监控数据,表的部分数据如下:
public ❯ select time, cpu, usage_user from cpu order by time desc limit 5;
+---------------------+-----------+---------------------+
| time                | cpu       | usage_user          |
+---------------------+-----------+---------------------+
| 2023-07-04T08:17:50 | cpu0      | 0.0                 |
| 2023-07-04T08:17:50 | cpu1      | 0.6012024047821427  |
| 2023-07-04T08:17:50 | cpu2      | 0.0                 |
| 2023-07-04T08:17:50 | cpu3      | 0.20040080160339818 |
| 2023-07-04T08:17:50 | cpu-total | 0.2503128911078006  |
+---------------------+-----------+---------------------+
这个表每 10 秒会记录一次 cpu 的相关数据,我们想要监控该表中各cpu的usage_user值,当过去一分钟内它的平均值大与 0.2 时,发出告警到 slack。
创建Rule
curl --location 'http://localhost:30001/api/v1/alert/config/rule' \
--header 'Content-Type: application/json' \
--data '{
    "tenant": "cnosdb",
    "data": {
        "enabled": "on",
        "dbname": "public",
        "sqlType": 1,
        "sqlCmd": "select cpu, avg(usage_user) from cpu where time >= now() - interval '\''20'\'' SECOND group by cpu",
        "period": "15s",
        "thresholds": [
            {
                "checks": [
                    {
                        "value": "0.2",
                        "operator": 1
                    }
                ],
                "period": "Automation",
                "severity": "Medium",
                "endtools": [
                    {
                        "name": "slack",
                        "receiver": "https://hooks.slack.com/services/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",
                        "format": "{{dbname}}{{sql}}{{name}}{{period}}{{description}}{{threshold}}",# 添加要展示在通知中的参数值,目前支持这六个参数
                        "tool": "slack"
                    }
                ],
                "checkrelation": 0
            }
        ],
        "name": "cpu new",
        "description": "cpu local demo",
        "field": "AVG(cpu.usage_user)",
        "additionalRetrospectiveTime": "5s"
    }
}'
在Slack查看接受到的通知